Money
This Aussie vegetable is harvesting into a $100M industry

When you think about the Aussie export market, you might think about coal, meat or even gold… but this golden vegetable is making its way to the top of the country’s export list.

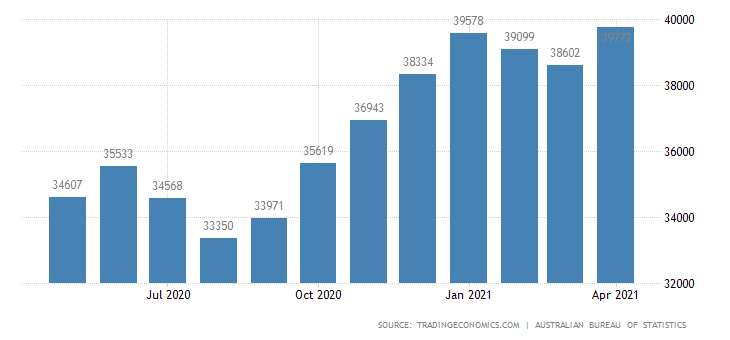
Australian carrot exports rose more than 7 per cent last year to become a $100 million dollar industry.

While exports of fresh vegetables were down overall last year, carrot exports increased in both volume and value.
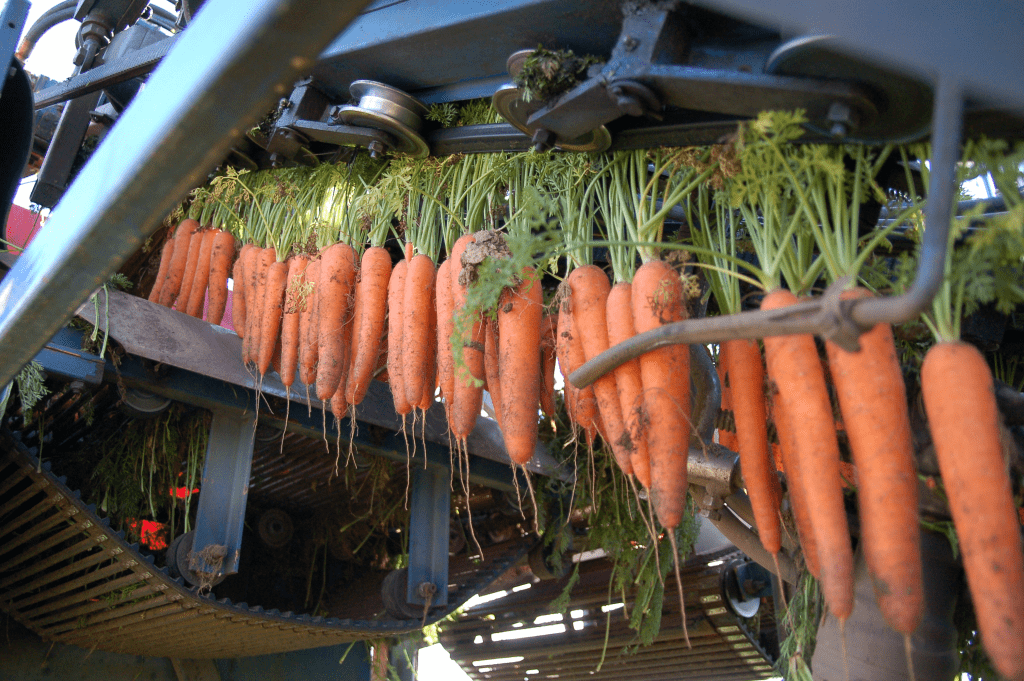
Over 110,000 tonnes of carrots were exported last year with the majority sent to Asia and the Middle East.
Western Australian carrot production continues to expand to meet increasing international demand, and the state accounted for 85 per cent of carrot exports.

Incoming AUSVEG chief executive Michael Coote says that with hospitality and the food service sector shutting down in Australia as a result of the pandemic, the exact same situation was happening in export markets.
“Restaurants, cafes, hotels, bars and pubs were all shut down and people were eating from home. So retail demand went up considerably in a lot of countries, as it did here … and carrots, as a staple vegetable that we use in the majority of the dinners, did too. The same thing was happening in Singapore, Hong Kong and all of our major markets.”
“Carrot exports have continued to grow, especially in the past couple of years,” Mr Coote told abc.net.au.
What other goods lead Australia’s export market?
The nation still leads the world when it comes to exporting iron, coal and petroleum gases.
Australia’s biggest export products by value in 2020 were iron, coal, petroleum gases, gold and aluminium. In aggregate, those major exports account for 63.1% of overall exports sales from Australia.

The following export product groups categorize the highest dollar value in Australian global shipments during 2020. Also shown is the percentage share each export category represents in terms of overall exports from Australia.
- Ores, slag, ash: US$91.3 billion (35.9% of total exports)
- Mineral fuels including oil: $65.4 billion (25.7%)
- Gems, precious metals: $19.6 billion (7.7%)
- Meat: $10.4 billion (4.1%)
- Inorganic chemicals: $5.2 billion (2%)
- Machinery including computers: $4.4 billion (1.7%)
- Cereals: $3.8 billion (1.5%)
- Pharmaceuticals: $3.4 billion (1.4%)
- Electrical machinery, equipment: $3.1 billion (1.2%)
- Aluminum: $3.1 billion (1.2%)